Rankin Climate utilizes cutting-edge data visualization tools to present information in compelling ways. We have expertise developing easy-to-use, interactive dashboards that are tailored to clients’ needs and allow them to explore a wide range of variables and relationships in the data. These products are designed with the purpose of enabling clients to broaden their understanding of survey results and help facilitate data-driven decision making.
Our team possesses the expertise to compile data, conduct exploratory reviews, provide targeted analysis and generate key takeaways sensitive to client needs.
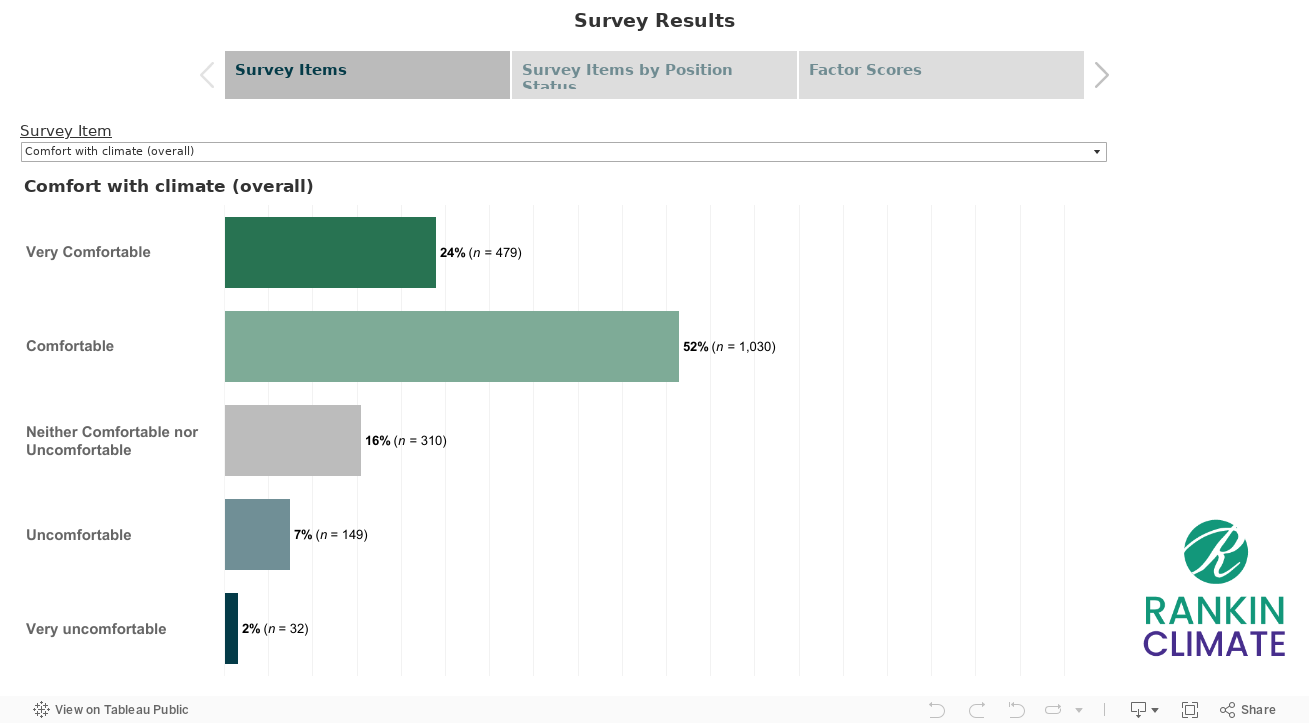
See an example dashboard below to explore how we transform complex climate data into actionable insights through interactive visualization.